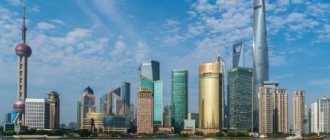
Comparison of area and population of Russia and China
Today, Russia and China are often discussed in the arena of international economics, and their importance in politics is acquiring a dominant position. The indicators of GDP, HDI, export and import volumes are becoming more and more serious - especially in comparison with previous periods, countries have achieved significant success. Russia and China have remained important partners for several centuries, and despite epoch-making changes, their cooperation is still of high importance to each of them. In many ways, strong relations are associated with territorial features, which predetermined their connection for many years.
Undoubtedly, both states are leaders in the ranking of leading powers, but many Russians are interested in what criteria they are often compared with and in what ways they are inferior to each other. It is probably still important to track economic indicators, territory size, population density, army size and other characteristics.
When talking about Russia as a world power, the millions of square kilometers it has immediately come to mind. It is the Russian Federation that is ahead of all countries in terms of territory occupied in the world; it owns 17,125,191 square meters. km. land area. Such majesty gives the advantage of owning the largest reserves of natural resources and minerals. If we consider the area of China and Russia in comparison, then China is inferior by 7,526,229 square meters. km., but the People's Republic of China covers 9,598,962 sq. km., which is also not bad.
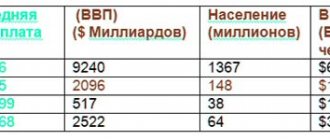
You can compare Russia and China in more detail in terms of urbanization and demographics using the following characteristics given at the beginning of 2021:
| № | Characteristics | Russia | China | More details |
| 1 | The area of the land | 17,125,191 km2 | 9,598,962 km2 | In the official list of occupied territories, Russia is in 1st place, Canada in 2nd place, China in 3rd place. |
| 2 | Number of cities | 1117 | 657 | In Russia, of which: about 171 cities with a population of over 100 thousand people |
| 3 | Cities with over a million people | 15 | 100 | The PRC plans to merge several cities, which will lead to the emergence of the largest city in the world, where 40 million people are planned to live. |
| 4 | Total number of people | 146.745 million | 1.405 billion | The East Asian state ranks first in the world in terms of population, the Russian Federation is ahead by 1.258 billion people. |
| 5 | Urban population | 75% | 52% | The indicator is progressing in both countries |
| 6 | Human Development Index | 0,824 | 0,758 | The Russian Federation ranks 49th in the world rankings, China ranks 85th. Such indicators are generally considered to be in the “high” category. |
| 7 | average life expectancy | 71,9 | 76,4 | These are the average numbers in the ranking of countries |
| 8 | Natural increase in population per year | 0-0,1 | 4,7 | Recently, the same number of people are being born and dying in the Russian Federation, which does not result in an increase. |
| 9 | Population density per sq. km | 8.56 people | 650 people | China is in 13th place in the world ranking, Russia is in 181st place |
Russia and China are often declared around the world as potential superpowers. Both states are permanent participants in the UN Security Council, along with Great Britain, the USA, and France. Also included in the SCO, APEC, G20, BRICS, WTO. Compared to the PRC, the Russian Federation takes an active part in other international organizations, often related to European cooperation.
Regarding military affairs, the Russian Federation is the leader in nuclear weapons in the world, ahead of the United States of America. But China has the world's largest army. Today, only 9 countries have military dominance, also on the list are the USA, France, Great Britain, India, Pakistan, Israel, and North Korea. Here we note that Russia and the United States are actively fighting for primacy in the space industry.
In comparison, the statistics look like this:
| № | Characteristic | RF | China |
| 1 | Total number of nuclear warheads: | 7000 | 270 |
| 2 | Of these installed nuclear warheads | 1950 | – |
| 3 | For storage of nuclear warheads | 2350 | 270 |
| 4 | Removed from nuclear warhead sites | 2700 | – |
| 5 | The size of the army, including the navy or navy, ground forces, airborne troops | 900,000 people | 2,035,500 people |
| 6 | Armed force in reserve | 2,572,500 people | 510,000 people |
| 7 | Army budget | $44 billion | $286 billion |
8-9. Chongqing and Xi'an (142nd place)
Chongqing and Xi'an shared 142nd place in the ranking. Chongqing is located in central China. Population: 7.5 million people. It is one of the most important industrial and commercial centers in the country.
The GDP per resident of Chongqing is 30,803 yuan per year - twice the national average. This means that the city has one of the highest standards of living in China. But the city’s “economic miracle” is different from other provinces. It was ensured by the acceleration of the pace of urbanization, the reduction of social inequality, the strengthening of the role of the state, the attack on the mafia and the provision of social housing.
Xi'an is located in the eastern part of China. The city, with a 3,000-year history, was one of the four ancient capitals of China during thirteen dynasties. The city's population is 6.95 million people.
Xi'an occupies a special place in the country. It’s like a look into the country’s past, its history, roots and origins.
The Great Silk Road began from Xi'an and Buddhism began to spread in the middle of the 7th century. The city is the largest center of domestic and international tourism. Xi'an is home to many public and private universities.
Comparison of the economy and GDP per capita of China and Russia by year
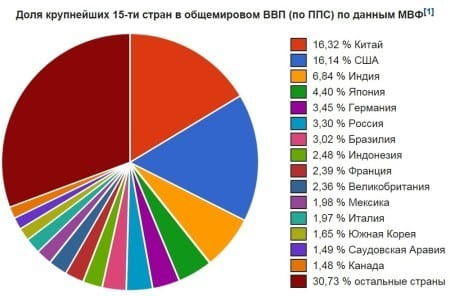
Economic growth can be tracked by financial statistics published by international organizations such as the World Bank and the International Monetary Fund. Financial institutions have full authority to monitor data. Today, the leading indicators are GDP and GDP per capita. Developed countries have both indicators at a high level, while developing countries usually have low GDP per capita. Today, both Russia and China lag behind world powers in terms of GDP per capita, but the state is taking every measure to increase the numbers.
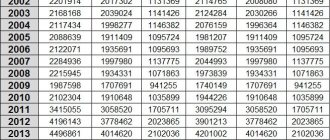
Table of macroeconomic indicators for comparison for the period from 2000 to 2021:
| in the Russian Federation | for the People's Republic of China | Difference | ||||
| Year | GDP nominal in trillion. USD | GDP per capita in USD | GDP nominal in trillion. USD | GDP per capita in USD | GDP nominal in trillion. USD | GDP per capita in USD |
| 2000 | $0,278 | $4878 | $1,211 | $959 | -0,933 | 3919 |
| 2001 | $0,328 | $5309 | $1,339 | $1053 | -1,011 | 4256 |
| 2002 | $0,369 | $5468 | $1,471 | $1149 | -1,102 | 4319 |
| 2003 | $0,461 | $6545 | $1,660 | $1289 | -1,199 | 5256 |
| 2004 | $0,632 | $6873 | $1,955 | $1 509 | -1,323 | 5364 |
| 2005 | $0,818 | $7230 | $2,285 | $1 753 | -1,467 | 5477 |
| 2006 | $1,059 | $7437 | $2,752 | $2099 | -1,693 | 5338 |
| 2007 | $1,391 | $8235 | $3,550 | $2694 | -2,159 | 5541 |
| 2008 | $1,778 | $8405 | $4,594 | $3468 | -2,816 | 4937 |
| 2009 | $1,309 | $9157 | $5,101 | $3832 | -3,792 | 5325 |
| 2010 | $1,632 | $11447 | $6,087 | $4550 | -4,455 | 6897 |
| 2011 | $2,044 | $14320 | $7,551 | $5618 | -5,507 | 8702 |
| 2012 | $2,202 | $15276 | $8,532 | $6317 | -6,330 | 8959 |
| 2013 | $2,289 | $15953 | $9,570 | $7051 | -7,281 | 8902 |
| 2014 | $2,058 | $14069 | $10,438 | $7651 | -8,380 | 6418 |
| 2015 | $1,356 | $9262 | $11,015 | $8033 | -9,659 | 1229 |
| 2016 | $1,280 | $8723 | $11,137 | $8079 | -9,857 | 644 |
| 2017 | $1,579 | $10751 | $12,143 | $8759 | -10,564 | 1992 |
| 2018 | $1,637 | $11289 | $13,608 | $9711 | -11,971 | 1578 |
| 2019 | $1,657 | $12243 | $13,368 | $9715 | -11,711 | 2528 |
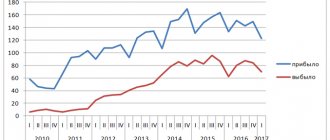
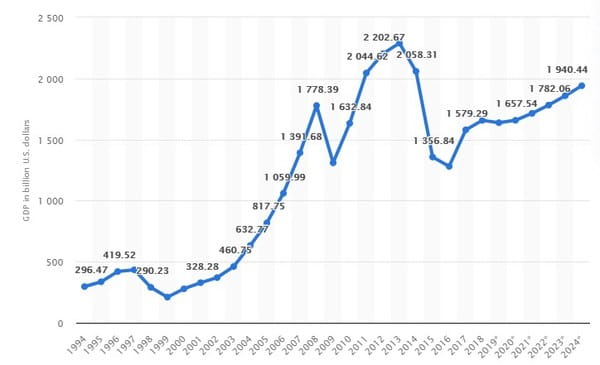
Analyzing the graph of GDP or GDP growth and the table data for the Russian Federation, we note that in Russia this indicator has increased from 2000 to 2019. had an unstable trend. The curve in the screenshot shows a slow increase from 1999 to 2008, then there was a sharp jump down and the rise began again. In 2014, a series of events related to international sanctions and devaluation again led to a decline in the economy. Since 2021, the situation has slowly improved and the economy has stabilized. The same jumps are observed in GDP per capita; in 2021, its figure reached $12,243 per Russian.
Chart 1. Russian Federation
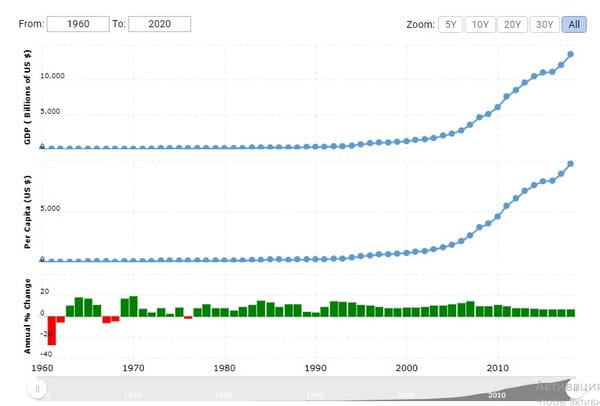
Let's look at the figures for China's Gross Domestic Product. The graph shows that the economy until 2000 was at the same level, but from 2000 the economy began to grow slowly. Since 2007, the curve on the graph has been steadily going up. During this period, trade turnover with many countries of the world increases, and it was at this time that China gained the name “International Factory”. The annual increase from 2000-2019 ranged from 8.49% to 14.23%.
Chart 2. China
But despite the PRC’s significant lead in GDP, another equally important indicator, GDP per capita, is significantly inferior to the Russian Federation, at $2,528. This means that about 1.7% live below the poverty line in China. Despite the country's total income of $13.368 trillion, the Chinese still receive low salaries and do not live in the best conditions. That is why the Asian republic is in the rank of “developing”. In the Russian Federation, inflation is 3%, unemployment is 4.7%. In China, inflation is 3.8%, unemployment is 3.62%
Citizen safety
Security is one of the basic human needs. When we are in danger, “caviar does not go down our throats, and compote does not pour into our mouths.” And the function of protecting the population is a key function of any state.
Let's look at the successes of Russia and China. The index has been calculated since 2012:
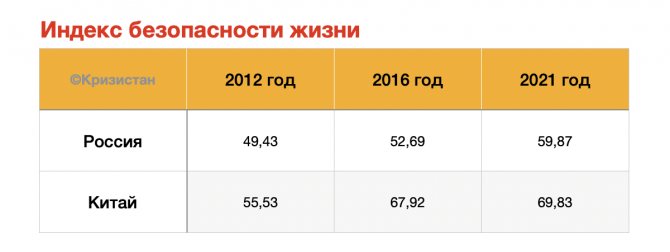
Our index has grown by 21% since 2012. In China - by 26%. It would seem that you can start to be proud, but don’t rush.
Tax table of two countries
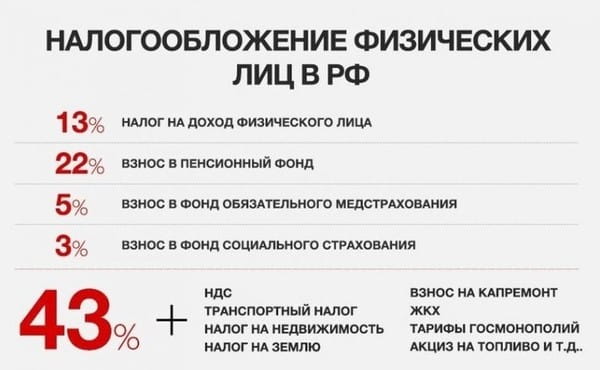
Taxation plays a significant role in replenishing the state budget. The tax system operates on the basis of the Constitution and many legislative acts. In the Russian Federation, control over the calculation and payment of taxes is carried out by the Federal Tax Service and the Tax Inspectorate. In the People's Republic of China, this role is performed by the State Administration of Taxation.
In recent years, the tax structure of the Russian Federation has been revised by the Government several times, after which about 12 taxes were adjusted and abolished. Today there are only 15 taxes in force, which is slightly less compared to the Chinese state. There are 17 taxes in the Asian republic, which are calculated at a fixed rate or at a progressive rate.
For comparison, here are the main taxes established for legal entities and individuals:
| № | Taxes | Russian Federation | Republic of China |
| 1 | Corporate income tax | 20% | 10-25% |
| 2 | Business tax | – | 3-20% |
| 3 | Property tax | 0,1-2% | 10-30% |
| 4 | Income tax (PI) | 13% | 3-45% |
| 5 | PN for private business | 13% | 5-35% |
| 6 | PN for households and self-employed | 13% | 20-40% |
| 7 | Property tax | 2,20% | 3-5% |
| 8 | Value added tax | 0-20% | 16% |
| 9 | Consumption tax | 3-50% |
Compared to the tax burden in China - 55%, the average Russian pays 45% to the budget. But more favorable conditions have been established for businessmen in China: corporate tax and value added tax rates are gradually being reduced. Russian businessmen often say that on the Chinese side it is much easier to open a business and easier with taxation and financial reporting. Many entrepreneurs require additional revision of the Tax Code of the Russian Federation.
Comparative characteristics of living standards in Russia and China
To determine the quality of life in both countries, you need to compare the school and higher education systems, culture, mentality, and ecology.
Comparison of the education system
Considering that the Republic of China adheres to socialist views, and Russia has socialist roots, the education system is not much different:
- In both countries, children go to school from the age of 6 and are required to study in the 9th grade. You can then continue your school education or enroll in vocational training. Public schools and kindergartens are free everywhere. A unified exam has also been established to determine the knowledge of graduates. The only disadvantage of Chinese schools is the number of students in classes; they can accommodate up to 50-60 students.
- Higher institutions in Russia and China have been transferred to the education system according to the Bologna Agreement. This means there are bachelor's, master's and doctoral degrees. Subsidies, scholarships, and student exchange are supported by programs of private and public institutions. In the world ranking of education, Russian education ranks 32nd, while Chinese education is the leader among Asian countries.
- When considering the infrastructure of an educational institution, Chinese universities excel in this comparison. Their campuses have undergone complete renovation and look like huge high-tech scientific centers with laboratories, libraries, and museums.
- Today, a Chinese diploma of higher education is valued even in America and Europe, so more and more Americans, Europeans, and Russians are coming there to study. The bulk of those from abroad are citizens from Southeast Asia. There are also a large number of foreign students from the CIS in Russia.
- But still, if you compare the prices of studying at a university, it is cheaper for a Russian to study at home. In China, for one year a student pays a minimum of $2670, at home $1570. Plus, housing rents are expensive abroad, but the lucky ones can get a hostel.
Comparison of culture
The states have significant cultural differences. Coming to the Celestial Empire, you are faced with completely different traditions, mentality, habits, behavior, and religion. Previously, the Chinese were not so religious, but now they increasingly adhere to Buddhism, Taoism or Confucianism. National policy does not support this and inclines residents more towards work and submission, but modern Chinese are no longer the same as before, they have more democratic views. A big disadvantage for the Chinese people is their lack of knowledge of the English language - it is quite difficult for them to learn foreign languages, so when you arrive there you immediately encounter a language barrier.
The Chinese are very hardworking people, and this is true, but they still know how to relax. They built a large number of karaoke clubs, where they most often go after hard days at work. They also love to spend time with their family, often having dinner together at a restaurant or at Street Foods, since they rarely cook at home. The Chinese have the largest number of millionaires and billionaires; they love expensive shopping and cultural entertainment in the form of gambling. Currently, all casinos from mainland China have been moved to the Macau Peninsula, where wealthy Chinese flock in the evenings.
Separately, it is worth noting Chinese business etiquette; its main difference from Russian is that the Chinese treat people of the older generation and senior management with special respect. Equal relations between generations and persons holding high positions are not allowed. In Russia, on the contrary, this is being eradicated following the example of the West.
Comparison of environmental indicators
Today, the environment in China is one of the worst in the world. This phenomenon is associated with a huge number of industrial plants, cars, and man-made accidents. In addition to polluted air, poisoned land and soil have been found in some regions. In large cities, there is constant smog, which is why about 1 million Chinese fall ill every year. In terms of environmental pollution, China ranks 13th in the world ranking with a coefficient of 81.24, Russia is in 54th place in this list with a coefficient of 63.49. With such figures, the countries are far from Finland, which is in the lead and is the cleanest region in the world.
Living standards in China are rising - now is the time to start reforms
Those who only read the headlines may be pessimistic about the current state of China's economy. Much of the latest news has focused on a crackdown on capital flight, concerns about rapidly rising debt and efforts to contain risky overseas investments.
However, ordinary Chinese are quite optimistic: China's consumer confidence index has reached 114.6, a level not seen since 1996. This is a logical reaction to some significant improvements in the country's economic prospects. And this gives the government the opportunity to carry out reforms.
In terms of key indicators of well-being, the Chinese have every reason to be optimistic. The official unemployment rate has dropped to 4% and property prices are still rising even in so-called tier 2 and 3 cities. Stock markets in Shenzhen and Shanghai have posted gains of about 9% this year, and foreign exchange reserves are also increasing. The yuan has strengthened so much that the central bank has made life easier for short traders.
Not surprisingly, trust in China has increased significantly. The consumer expectations index reached 117.4 in July, the highest since 1993, according to the National Bureau of Statistics. Indices that gauge confidence among stock investors and economists also rose thanks to a strong labor market and sustained gains in asset prices.
Although such indicators are often imprecise, they are of great importance - because confidence can be self-reinforcing. As long as investors have faith in a market or an asset, prices can fluctuate over time. Property prices have reached $858 per square foot in Beijing not because of phenomenal returns, but because buyers are confident they will continue to rise by 10% a year. Likewise, although China's banking system is in poor shape, the government is maintaining confidence in banking by dispelling rumors and reassuring depositors.
However, trust is a fragile thing and there is reason to believe that the good times will not last long. One reason to think so is that many of the above gains are the result of a credit binge: with officials eager to ensure sustainable growth ahead of the Communist Party's national congress, overall funding for social programs rose 21%. The longer the drinking lasts, the worse the hangover.
Meanwhile, China's fundamental problems have not gone away. There is still a surplus of production capacity and little sign of much-needed reform. Efforts to overhaul state-owned enterprises have largely stalled. At the moment, the situation with bad loans is stabilizing, but it cannot be denied that serious risks are still accumulating in the Chinese economy. With property prices in the country's leading cities already among the highest in the world, the appeal of lending seems increasingly urgent.
Strengthening consumer confidence gives government a decisive voice in addressing these issues. Declining productivity, and therefore employment, will be less painful when workers in the mining and manufacturing industries are more optimistic about their chances of finding new jobs. Scaling SOE will be easier if officials have confidence that private enterprises can compensate for miscalculations. It is wise to take financial risks when opportunities are visible elsewhere. The decline in real estate borrowing—the most important asset for Chinese households—will be painful no matter what, but the risk of panic or unrest is greatly reduced when wealth rises.
Either way, China needs to make painful changes in monetary policy to slow or reverse the imbalance in the economy. It's better to start now, when the public is rightly confident that a brighter future is possible.
Comparative analysis of prices in China and Russia in 2021

It is important to make price comparisons between states. Using numbers you can find out where it is cheaper to live. There is an opinion that the cost of living in both countries is approximately the same, in fact this is true - in the Russian Federation the cost of living is on average $323.55, in China $304.15. But if we look at the specifics of pricing policy, then due to a number of reasons, real estate in China is one of the most expensive. The large number of Chinese has led to an artificial increase in housing prices even in not the most favorable areas. If we consider the prices of food and clothing, then in China it is probably cheaper.
Comparative tables for main product groups:
Tab.1
| № | Products | Cost USD, in Russia | Cost USD, in China |
| 1 | Fruits | $0,98-1,25 | $0,99-1,63 |
| 2 | Vegetables | $0,42-1,89 | $0,92-1,13 |
| 3 | Beef | $6,59 | $10,08 |
| 4 | Chicken meat | $3,75 | $3,61 |
| 5 | Eggs 10 pieces | $0,93 | $1,34 |
| 6 | White rice | $1,01 | $0,95 |
| 7 | Dairy | $0,89 | $1,80 |
| 8 | Dairy products | $7,00 | $14,44 |
| 9 | Distilled water | $0,58 | $0,55 |
| 10 | White bread | $0,51 | $1,36 |
| 11 | Alcoholic drinks | $0,92-6,32 | $0,76-10,20 |
| 12 | Cigarettes pack | $1,89 | $2,91 |
Tab.2
| № | Clothes and shoes | Cost USD, in Russia | Cost USD, in China |
| 1 | Branded jeans | $39,09 | 28,90 |
| 2 | Dress in a brand store | $42,12 | $34,35 |
| 3 | High quality sneakers | $40,54 | $42,63 |
| 4 | Leather shoes | $50,63 | $39,22 |
| 5 | T-shirt | $12,15 | $8,10 |
| 6 | Shirt | $22,10 | $10,16 |
| 7 | Hoodie | $15,08 | $9,50 |
| 8 | Sports suit | $35,23 | $23,40 |
Tab.3
| № | Housing and car expenses | Cost USD, in Russia | Cost USD, in China |
| 1 | Buying an apartment in the city for 1 sq. m. | $4 125,69 | $6 864,89 |
| 2 | Buying an apartment outside the city for 1 sq. m. | $1 019,95 | $2 990,83 |
| 3 | Rent a 1-room apartment in the city | $462,82 | $512,46 |
| 4 | Renting a 1-room apartment outside the city | 327,39 | 290,58 |
| 5 | Rent a 3-room apartment in the city | $812,28 | $1 111,92 |
| 6 | Rent a 3-room apartment outside the city | $554,69 | $850,16 |
| 7 | Public utilities | $102,80 | $49,50 |
| 8 | Internet per month | $6,72 | $13,99 |
| 9 | Economy class car | $18 904,45 | $21 836,10 |
| 10 | Gasoline 1 liter | $0,62 | $0,94 |
| 11 | Taxi tariff for 1 km | $0,18 | $0,33 |
| 12 | Monthly pass | $26,90 | $17,46 |
Salaries in Russia and China
According to world rankings, wages in Russia and China are not considered high. On average, a Chinese receives from $500-1000, a foreigner receives many times more. Russian salaries can vary greatly within the country; in medium and large cities, monthly income ranges from $400-1500.
In comparison, we will show how much a Russian earns in Russia or China by position:
| Professions | in Russia | in China |
| Engineering Specialist | $950-1500 | $3000-10000 |
| IT specialist, developer | $1100-1600 | $2000-10000 |
| Accountant | $400-600 | $1000-3000 |
| Financier | $1000-2000 | $1800-2500 |
| General practitioner | $1000-1250 | $1000-3000 |
| Logistician | $780-1600 | $1300-1600 |
| Tourism manager | $700-1400 | $900-1700 |
| Sales Representative | $800-900 | $1000-1200 |
| Marketer | $600-3000 | $2000-5000 |
| HR manager | $1000-1250 | $1500-2000 |
| English teacher | $500-1500 | $800-1500 |
| Translator from English | $300-900 | $2000-3000 |
| Salesman-cashier | $450-620 | $500-800 |
| Builder | $780-1400 | $900 |
| Architect | $700-3600 | $1000-1500 |
| Designer | $470-500 | $2 000 |
| Musician | $350-1500 | $1500-2000 |
Welfare of the population
It can be expressed by one single indicator - local purchasing power. The more material goods the average resident of a country can afford on their own salary, the higher the standard of living in the country.
Numbeo compares the purchasing power of the population to a New York City baseline. The salary is taken after paying taxes and how many goods/services can be bought with it at New York prices. In the same way, another city or country as a whole is taken - with local net salaries and prices - and compared. As a result, both the basis and the compared indicator are dynamic. That is, the whole world is steadily moving forward, and the service monitors the situation as of the current date.
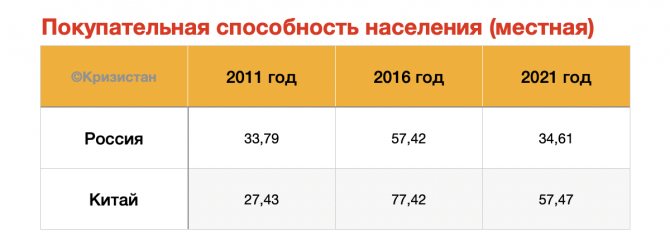
New York is 100%. A level indicator of 33-34 indicates that people’s well-being is 3 times lower. If not for a new type of crisis, China would have overtaken the United States in terms of purchasing power this year, or at most next year. Russia seems to have rolled back into the past.
Over 10 years, the local purchasing power of the Chinese population has increased 2.1 times. And for residents of Russia - only 2%. In words: two percent in ten years .